
The Artificial Analysis post is timed 2026-11-05T08:28:08.000Z, which is 16:28 in Beijing on Nov. 5, before this noon window and after the backfill line, so this is backfill. The post says Tencent Hy4 scores 35 on the Artificial Analysis Intelligence Index v5 and is the second model from a China-based lab, behind only Kimi K3.1 Pro at 46. The same passage says 35 ties Grok 4.7 (xhigh) and sits 1 point behind Claude Haiku 5.5 (max). This is the evaluator's post, not Tencent's earlier self-reported launch. The Tencent account later replied only with thanks and did not change the figures.
[1][2]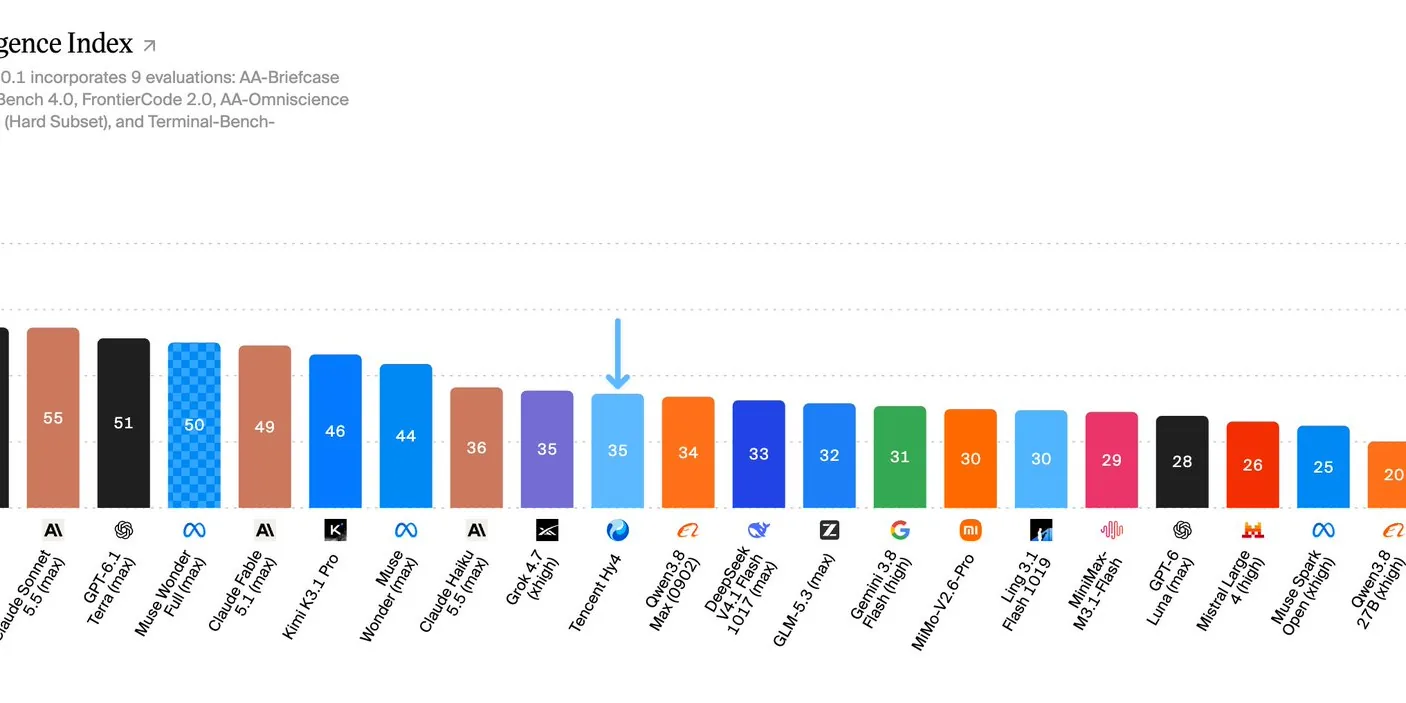
The listed price is $0.834 per million input tokens and $2.501 per million output tokens. Cache reads are $0.042 per million tokens. The context window is given as 1 million tokens. Input is text and image. Output is text. The post also gives a cost per index task of $0.78. On the post's own comparison, that cost for a score of 35 is one tenth of Grok 4.7 (xhigh), also at 35, one thirteenth of Qwen3.8 Max (0902) at 34, and almost twice Claude Haiku 5.5 (max) at 36. The tenth and the thirteenth are the post's multiples. This column does not recompute them.
[1]On coding, the post gives Hy4 31 percent on FrontierCode 2.0, Claude Fable 5.1 (max) 32 percent, DeepSeek V4.1 Flash 1017 (max) 28 percent, and Kimi K3.1 Pro 25 percent. It calls 31 percent the highest among models from China-based labs. On Terminal-Bench 4.0 it gives 37 percent and calls that the fourth-highest among those labs. On knowledge, it gives 50 percent accuracy on AA-Omniscience v1.1, 1 point ahead of Kimi K3.1 Pro, and a hallucination rate of 89 percent against 37 percent for Kimi K3.1 Pro. On HLE-Diamond it gives 33 percent against 37 percent for Kimi K3.1 Pro. The 50 percent and the 89 percent are in the same sentence.
[1]The 35 therefore does not stand by itself. The hallucination rate, the price, and the two coding scores are in the same post. How the tests are constructed is not written as a procedure, and this column does not add one. The image is the post's index chart. After a wide crop, bars at the two ends are incomplete. The figures in the column follow the post's text, not a second reading of the picture.
[1]