
要点
- Top pass rate is only 32.7%—the long-horizon board still has signal
- Completion rate says more than pass rate about how far a run got
- New code is easier than refactors; cross-platform conversion remains open
- Choose model × harness, not a bare model score
Why 2.0 exists
Android Bench 1.0 scored local GitHub pull requests—median change about 32 lines across 1–2 files. Frontier models soon hit roughly 90% pass rate, and the ranking lost resolution.
2.0 replaces that with 30 long-horizon tasks, scoped like work that takes a mid-level to senior engineer days to a week: building multi-screen apps from mocks, library and architecture migrations, platform features in mature repos, and converting Flutter / React Native apps to native Compose. Scale moves to thousands of lines and hundreds of files—an exam in coding becomes an exam in engineering.
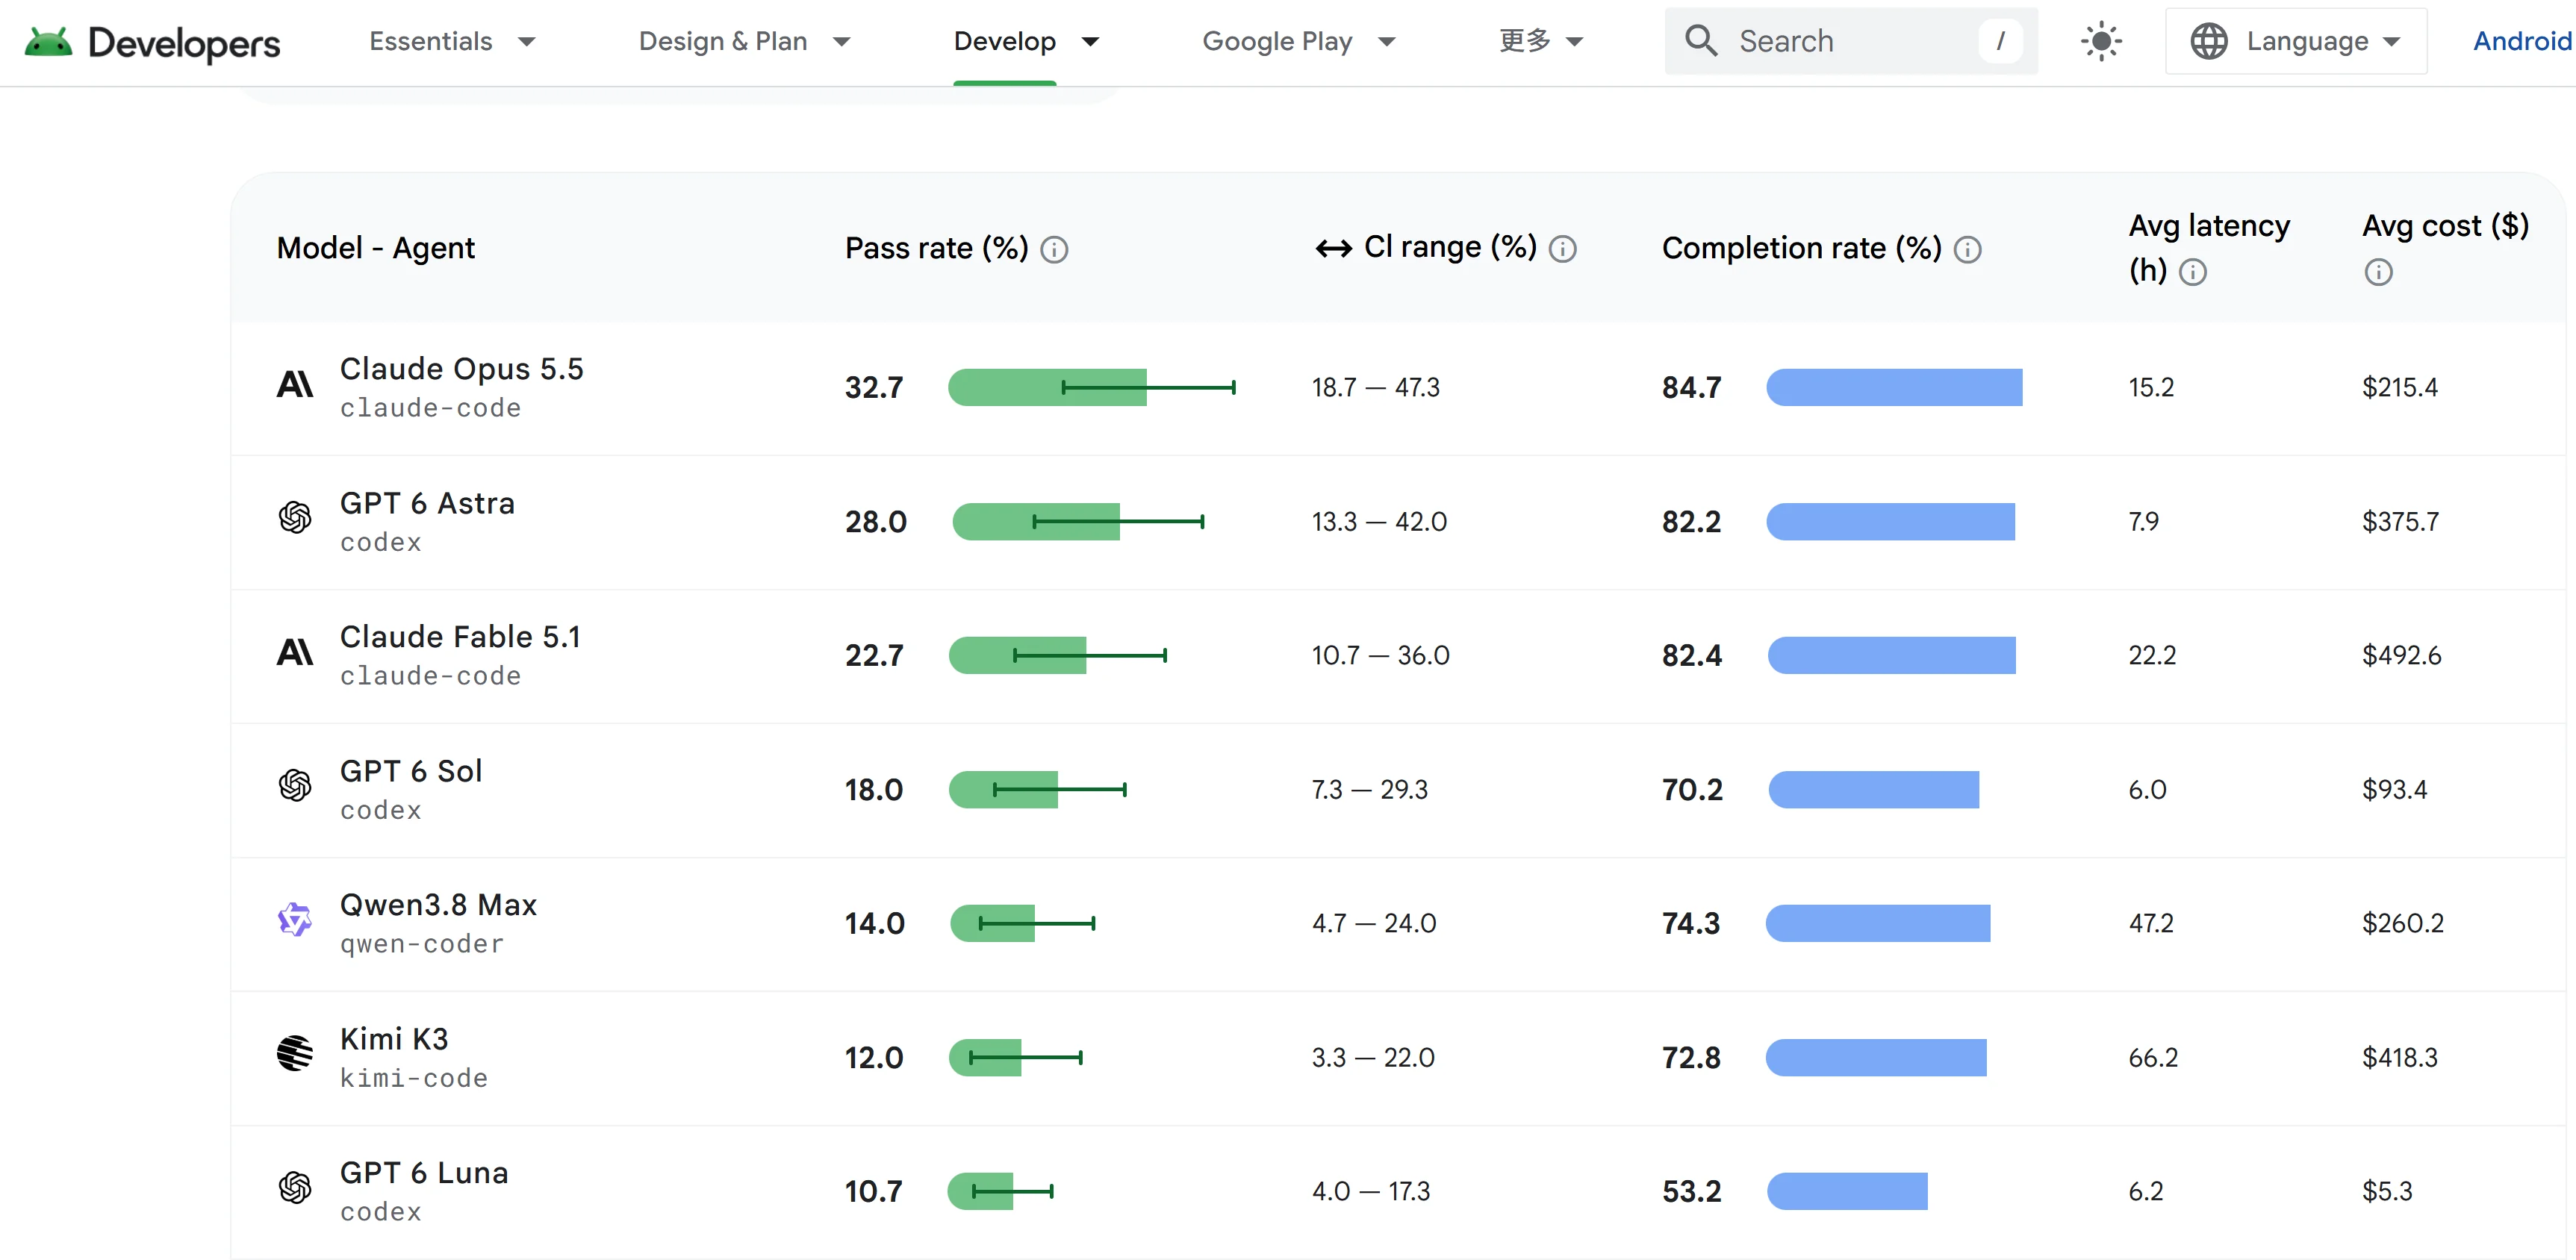
[1][2]Top seven on the long-horizon board (2026-10-10)
Claude Opus 5.5 · claude-code
- Pass rate
- 32.7%
- Completion
- 84.7%
- Latency
- 15.2 h
- Avg cost
- $215.4
GPT 6 Astra · codex
- Pass rate
- 28.0%
- Completion
- 82.2%
- Latency
- 7.9 h
- Avg cost
- $375.7
Claude Fable 5.1 · claude-code
- Pass rate
- 22.7%
- Completion
- 82.4%
- Latency
- 22.2 h
- Avg cost
- $492.6
GPT 6 Sol · codex
- Pass rate
- 18.0%
- Completion
- 70.2%
- Latency
- 6.0 h
- Avg cost
- $93.4
Qwen3.8 Max · qwen-coder
- Pass rate
- 14.0%
- Completion
- 74.3%
- Latency
- 47.2 h
- Avg cost
- $260.2
Kimi K3 · kimi-code
- Pass rate
- 12.0%
- Completion
- 72.8%
- Latency
- 66.2 h
- Avg cost
- $418.3
GPT 6 Luna · codex
- Pass rate
- 10.7%
- Completion
- 53.2%
- Latency
- 6.2 h
- Avg cost
- $5.3
Four methodology choices worth noting
Contamination resistance. A private Food Vibes codebase, migrations that do not exist upstream (Nav 3 / Coil 3 / Ktor 3), conversions without a native counterpart, plus trajectory audits for reward hacking and hardcoding.
Multimodal verification. Pixel diffs break on status-bar clocks and battery icons (up to 47.5% diff on semantically correct screens). The suite uses emulator walkthroughs, a Gemini 3.5 Flash visual judge, and accessibility-tree checks.
Two scores. Pass rate counts only complete, compliant, zero-violation runs as 1.0. Completion rate keeps a 0–1 hill-climbing signal for near-misses.
Model × harness. Rows are Model · Agent, because harness design (caching, tool windowing) changes outcomes.
[2]Three practical rules
- New code beats old code. Refactors and migrations fail on architecture complexity, not line count.
- Deterministic transforms are strong; fuzzy engineering is not. Java→Kotlin, Retrofit→Ktor, and adding a ViewModel hold up across 125+ files / 8,000+ lines. Runtime validation, breaking framework changes, and unreleased libraries are brittle.
- Cross-platform conversion is still open. No model reaches 100% pass on Flutter / React Native → Android; frontier completion tops out near 80%.
What failure looks like
For leader Claude Opus 5.5: CameraX avatar capture, promotions, Retrofit→Ktor, and Bitwarden dual-pane layout pass 5/5; Habo Flutter→Compose, SMS login, and the design-system library score 0/5, usually on failed tests or failed validation.
GPT 6 Astra shows the same pattern: several App creation modules above 90% completion still score 0/5. A low pass rate is not always “it cannot write the code”—it is often the last mile of acceptance.
[1]Advice for developers
- When choosing tools, read pass rate together with completion rate and cost.
- Treat acceptance as your moat: instrumentation tests, visual checks, and regression gates beat another model swap.
- Give long runs checkpoints. Multi-hour, multi-hundred-dollar jobs without intermediate review are a gamble.
Why this board matters
Android Bench 2.0 moves evaluation from patching skill to engineering skill: private tasks and trajectory audits against contamination, multimodal judging aligned with human UI quality, continuous completion for hill-climbing, and an honest Model × harness framing.
When first place is 32.7%, the benchmark has not lost its teeth.
[1]