
要点
- Databricks blog (Yuki Watanabe, 3 Nov 2026): native OpenTelemetry export from Claude Platform into Databricks MLflow is in Public Beta; traces land in Unity Catalog.
- Covers Anthropic SDKs, Messages API, and Claude Managed Agents; Claude Code / Agent SDK can hit the same destination with extra env vars.
- Ingest path: Zerobus Ingest → UC tables linked to an MLflow experiment; pitch is low-latency high-QPS plus governed access to sensitive spans.
- Inputs/outputs are captured only when content mode is set to “full”; MLflow then offers Analyze trace (Genie Code), Issues (Beta), Review Queues, and Agent Evaluation / compare runs.
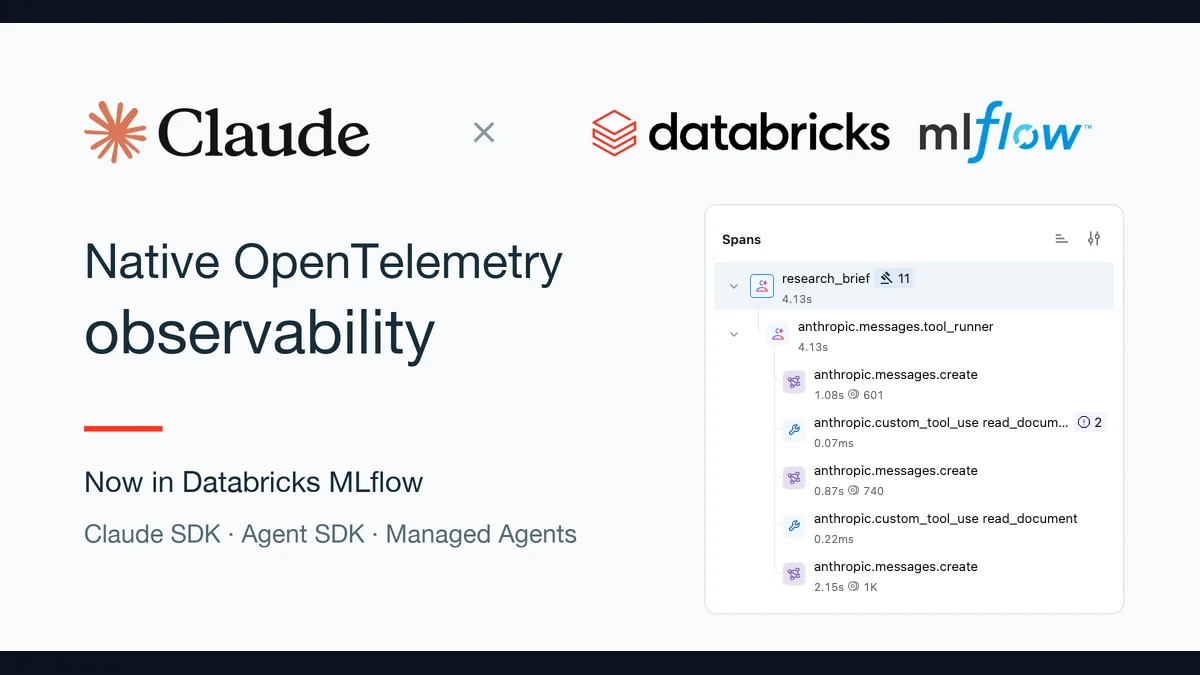
On 3 November 2026, Databricks’ Yuki Watanabe announced that the Claude Platform can export native OpenTelemetry traces into Databricks MLflow—Public Beta—with storage in Unity Catalog.
Thesis: This is less a model feature than a platform bet that enterprise agent debugging consolidates on open telemetry inside UC-governed warehouses—and that bet holds only if teams opt into full content capture without collapsing under privacy and governance cost.
[1]What shipped
An agent can return a plausible answer while missing a finding or re-reading the same source; the final answer alone will not explain why. Traces break the run into spans (model requests, tool calls). Claude’s native instrumentation emits those spans over the OpenTelemetry Protocol.
Databricks receives them via Zerobus Ingest into Unity Catalog tables linked to an MLflow experiment. The pitch is low-latency, high-QPS ingest plus governed access to sensitive agentic data. Setup is three steps: create an experiment with UC trace storage, configure workspace/region/spans table and a table-scoped OAuth token, then run a task and open Traces. Inputs and outputs are captured only if content mode is set to “full”—explicit opt-in, not the default.
[1]How hard is the evidence
Product facts check out on the page: native integrations cover Anthropic SDKs, the Messages API, and Claude Managed Agents; Claude Code / Agent SDK need extra env vars for the same destination. On the MLflow side the loop is spelled out—Analyze trace (Genie Code), MLflow Issues (Beta) for recurring quality/ops patterns with scheduled detection and post-fix scorers, Review Queues for domain experts, and Agent Evaluation / Compare on shared cases.
Limits are equally plain: vendor blog plus UI demos; the Issues screenshot notes Issue Detection was not run for the demo; no third-party throughput or governance-cost numbers; no measured debug depth under default (non-full) content mode. Evidence strength sits at “integration path and feature inventory,” not independent benchmarks.
[1]Steelman and gaps
Steelman: if every model vendor ships a private tracing console, debugging and eval fragment. Landing Claude spans in an existing OTel/MLflow/UC toolchain lets model calls, tool failures, and repeated retrieval share one SQL and ACL model with the rest of the stack—glue for teams already on Databricks, not another dashboard.
Gap: the thesis’s second clause is the hard constraint—full content capture is what exposes prompts, tool returns, and user data; refusing opt-in leaves skeletal spans and thinner Issues/review signal; turning it on pushes retention, redaction, and cross-tenant ACL cost onto UC and compliance. The post markets governance capacity but does not quantify the bill after “full” is on. Reading Public Beta as “enterprise agent observability is already unified” overshoots.
[1]Who pays, and what to watch
Payers are platform teams already committed to Databricks lakehouse + MLflow: they want one trace table, one eval loop, and one issue monitor across Claude and other services—not another proprietary APM. Falsifiers to watch: share of production traffic that actually enables full content; whether scheduled Issues stably catches patterns like redundant tool calls on real traffic; and whether UC permissions slow the debug loop. If fleets stay on skeletal spans indefinitely, the “unified observability” story stalls at the connector layer.
[1]Close
The defensible sentence: Claude→Databricks native OTel bets agent debugging on open telemetry inside a UC-governed warehouse rather than a model vendor’s private console—and that bet clears only if teams can afford the governance cost of full content capture. It does not yet prove that default (non-full) configs locate “missed finding” failures, nor that cross-stack unification is done—only that the Public Beta pipe is live.
[1]