
要点
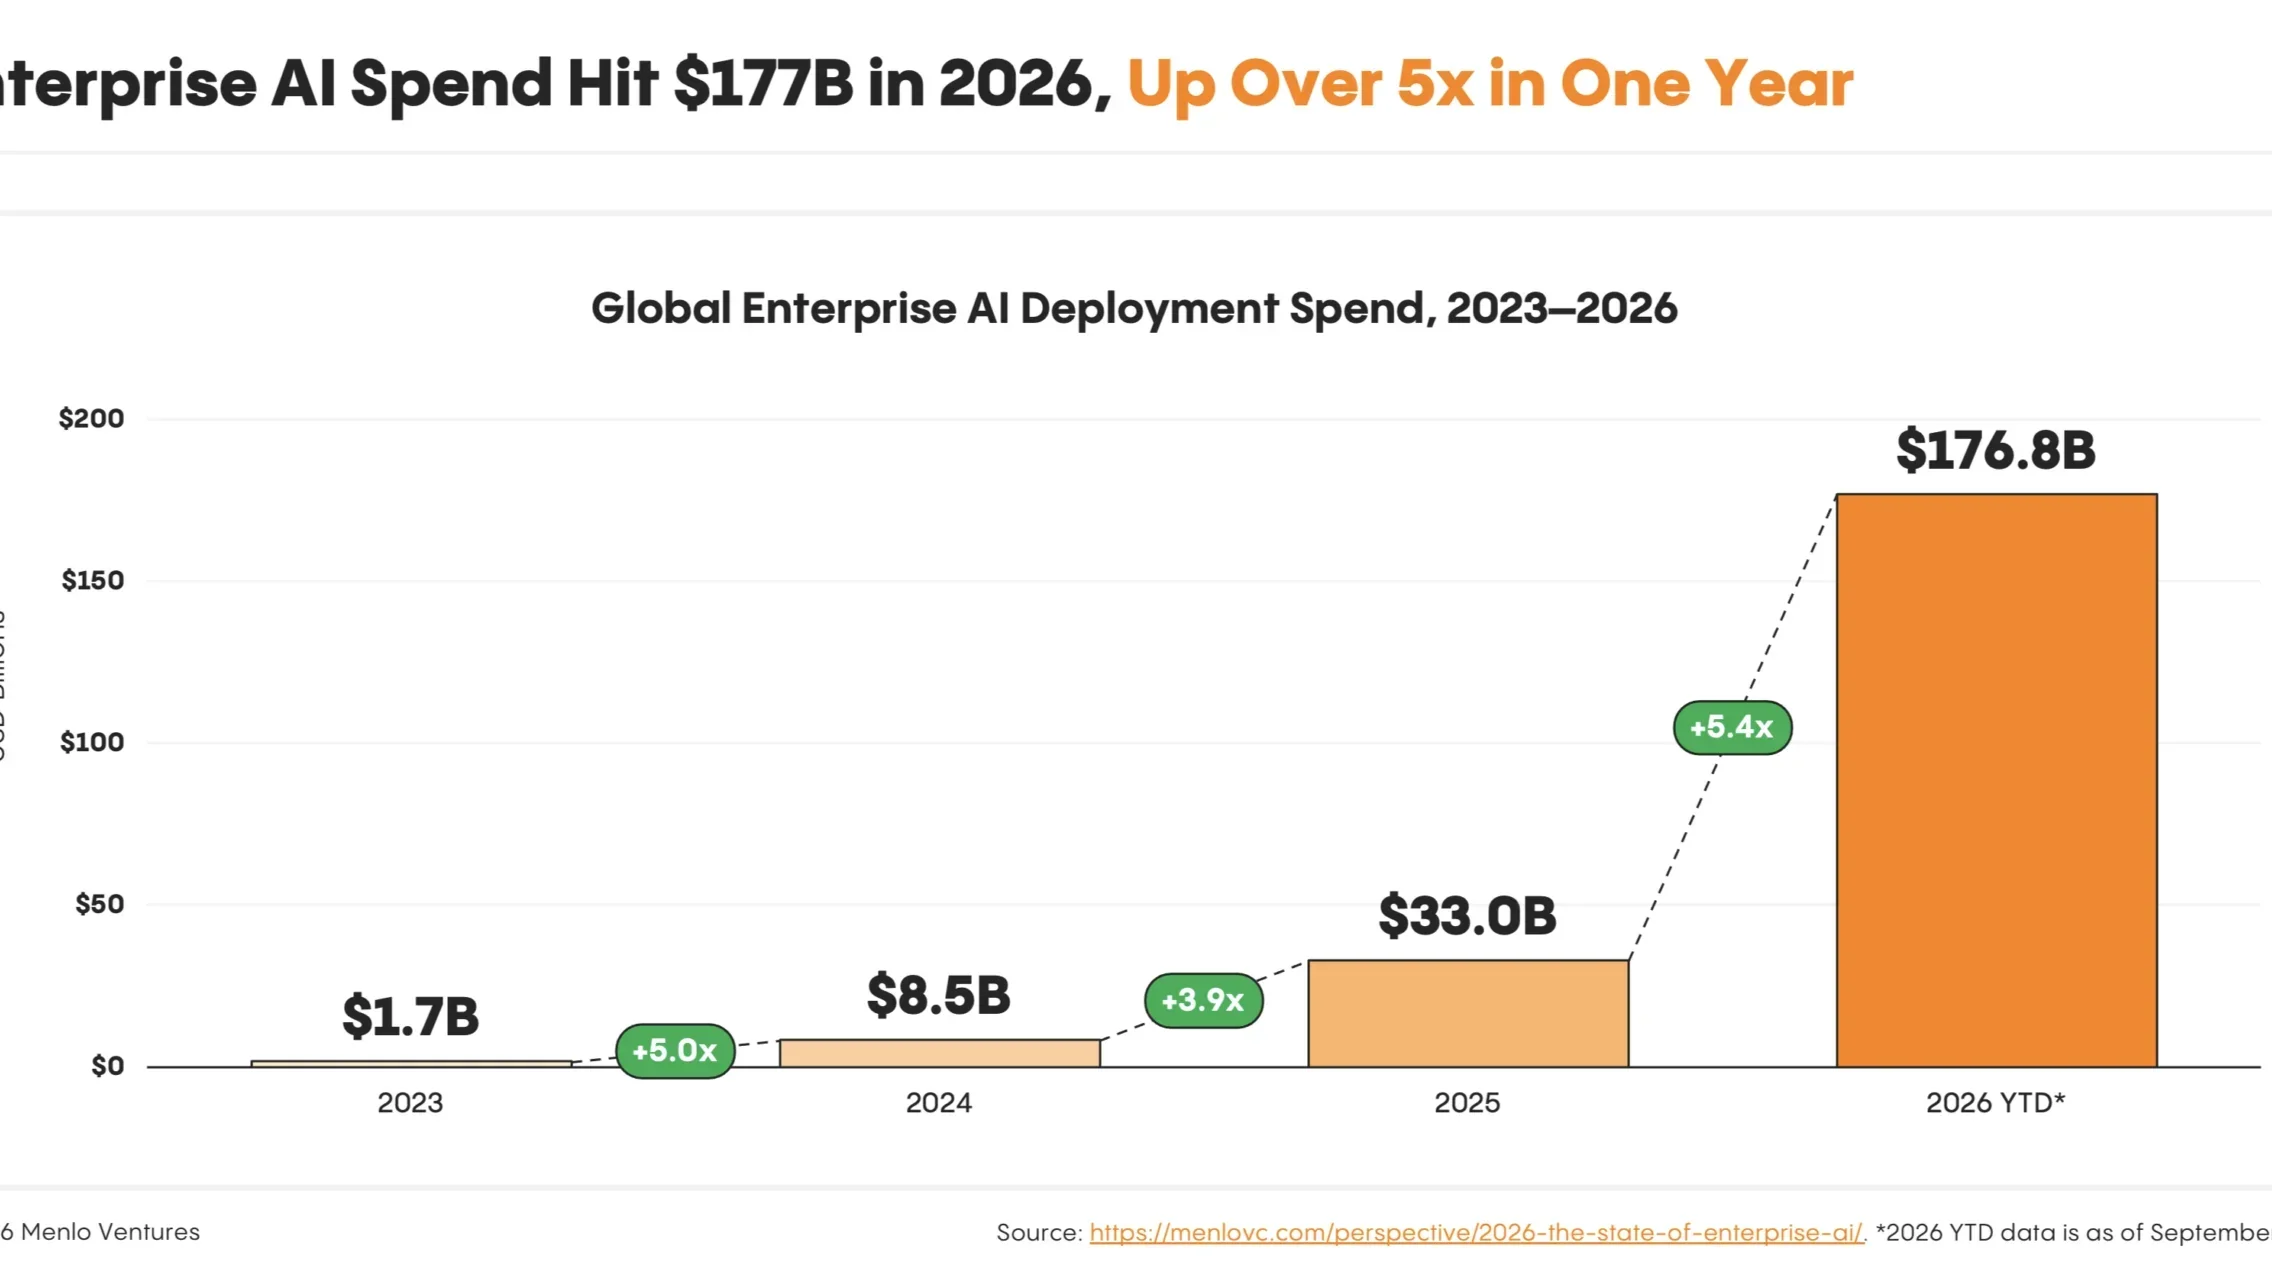
- Menlo Ventures (3 Nov 2026) estimates enterprise AI deployment spend at ~$177B / $176.8B by Sep 2026, from $33B last year (~5.4×); ~$1.70 of deployment revenue per $1 of model-development spend.
- Structure: frontier labs 69% of deployment dollars (50% last year); Anthropic enterprise API share 40%→55%, OpenAI 27%→31%, Google 21%→9%; open-source ~19% of usage / 4% of spend.
- Of a $77.3B app layer, coding $34.0B + chatbots $25.0B = 76%; on OpenRouter, agent traffic +37× since overtaking humans in February, agents ~80% of tokens. 55% of AI dollars from net-new budgets.
“SaaSpocalypse” assumes AI zero-sum cannibalizes existing software or labor budgets. Menlo’s fourth annual enterprise AI report draws a different structure: deployment spend jumps to ~$177B, over half of incremental dollars from new budgets, with the app layer concentrated where agents work—coding and chat.
Falsifiable read: the point is not “software is dead,” but whether spend truly scales with agent work rather than seats, and whether lab/app shares replicate in independent sources. If cloud filings, procurement panels, and lab reports cannot support structures like 5.4× and 69%/76%, discount “agents rewrote the enterprise AI spend equation.”
[1]Hard facts (Menlo Ventures; Tim Tully, Joff Redfern, Deedy Das, Derek Xiao; 3 Nov 2026; methodology: survey of nearly 400 U.S. enterprise decision-makers responsible for >$4B in AI spend, fielded by Morning Consult 8–26 Sep 2026; market sizing is Menlo bottoms-up estimates):
- Totals: deployment ~$176.8–177B (Key Findings say $177B; body $176.8B) from $33B, 5.4× (vs 3.9× the prior year). Development (building models) ~$102.5B vs deployment/using ~$176.8B—about $1.70 of use-side revenue per $1 into training.
- Lab share: Anthropic+OpenAI+Google ~$122.7B, 69% of deployment dollars (50% last year). Enterprise LLM API: Anthropic 40%→55%, OpenAI 27%→31%, Google 21%→9%; the two leaders 86% of API (67% last year). Open-source: usage 11%→19%, spend 6%→4%.
- Apps: app layer $77.3B; coding $34.0B + chatbots $25.0B = 76%; coding 96% AI-native; Claude Code+Codex ~$24.0B (70% of coding).
- Agents & budgets: on OpenRouter agents ~80% of tokens (~7× human), agent traffic +37× since overtaking humans in February; average enterprise spend 4.7× last year vs 1.9× planned; 55% of AI dollars from net-new budgets. Deployment spend >30% of public-cloud revenue (from ~6%).
Evidence strength: VC annual perspective + commissioned survey + bottoms-up market model, with OpenRouter and other third-party traffic inputs. Strength is structural granularity (labs/apps/open-source/native vs incumbents); limit is that dollar totals and shares are Menlo estimates triangulating survey weights and public disclosures—not a regulator/audited census. Some named companies are Menlo portfolio firms.
Steelman: if agents expand consumption with work rather than seats, budget overruns and spend concentration in verifiable environments (coding, support) are two sides of one mechanism—more testable than “AI replaces Salesforce.”
[1]Strongest steelman: filtering categories by “environments agents can act in + learnable context + verifiable outcomes” explains why coding/chat sprint while HR/marketing lag—a portable industrial hypothesis, not just a leaderboard.
Steelman risks: OpenRouter skews developers/startups; API shares depend on self-reported production mix; the ~$177B level is taxonomy-sensitive (prior years reclassified); portfolio conflicts are disclosed via asterisks and should be discounted by readers.
[1]For buyers: extend beyond model brands to agent infrastructure (sandboxes/search/browser adoption cited at 40%/30%/14%) and verifiable workflow design. For legacy SaaS: the report finds limited evidence of wholesale SoR replacement—more threat is growth dilution than overnight swap. For open-source: usage up, dollar share still thin; price wars and cache-hit mixes keep pressing average $/token down.
[1]Do not read Menlo’s map as a “SaaS is dead” verdict. Falsify whether agents keep raising deployment-per-seat, whether lab dollars stay concentrated, and whether non-coding verticals can install act/verify conditions. If independent cloud bills, procurement panels, and lab filings align, the story hardens; if not, dial it back to one VC’s high-resolution hypothesis.
【No.2】
[1]