
要点
- NVIDIA Technical Blog (2026-11-02) introduces open-source NVIDIA Recovery (DSX OS): workload-level automated recovery across a cluster’s training jobs; default monitor mode publishes advice before acting.
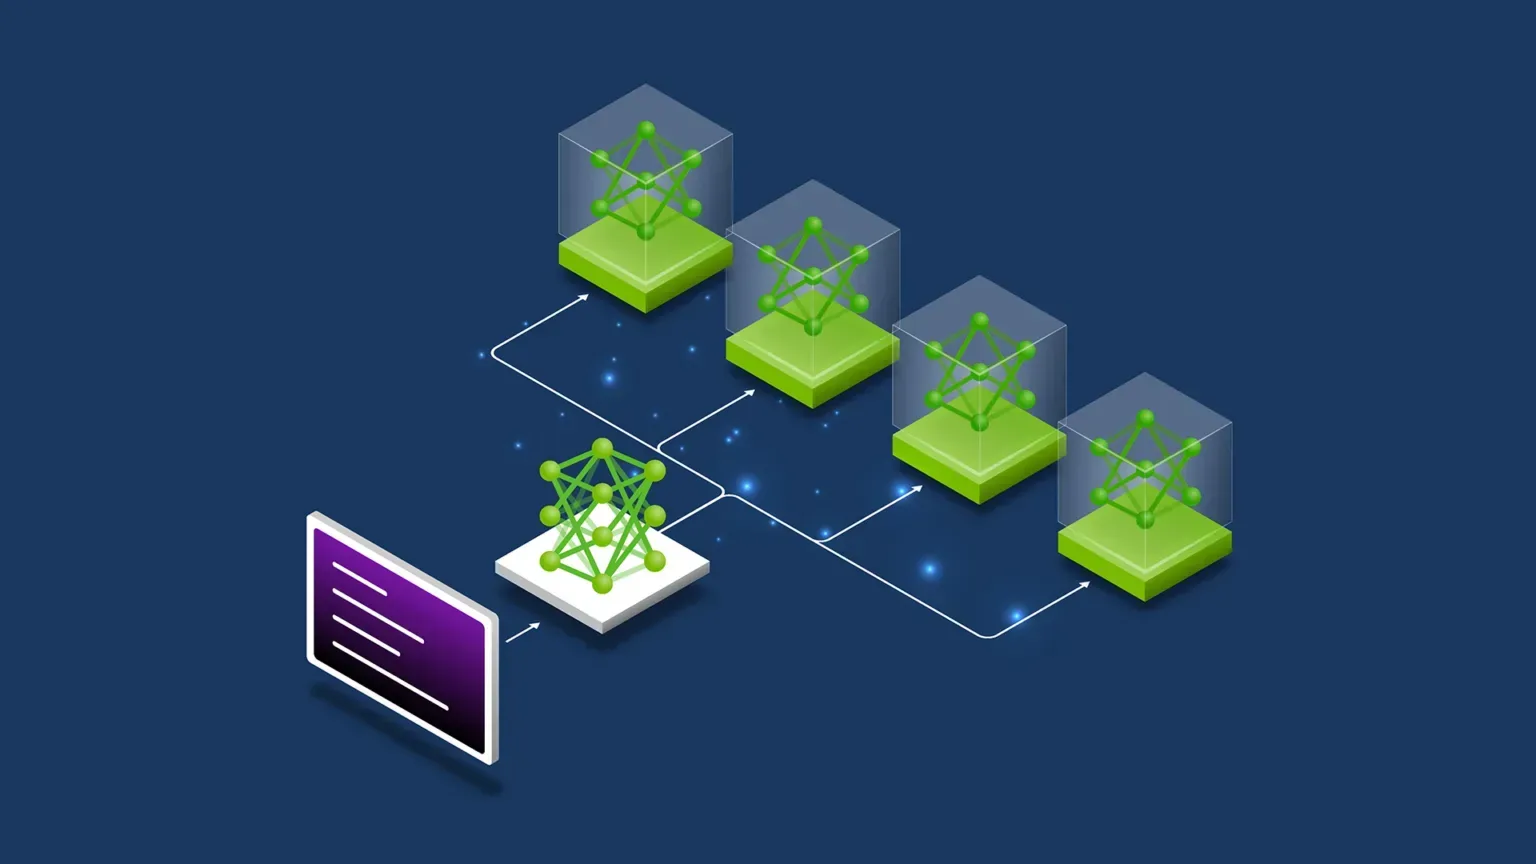
- Four-stage loop: Detect (logs/GPU metrics/scheduler) → Attribute (optional NVIDIA Attribution) → Isolate (exclude nodes / stop unproductive retries) → Restart or Stop via Advisor API into the scheduler.
- Production observation (one training cluster, 2026-07-09 to 10-09): ~200 jobs/day, ~8,550 anomaly detections; mean detection 69s, recovery-action 94s.
- Slurm reference Advisor Controller via Helm (in-cluster or SSH); IBM Research and Verda cited as early paths; native K8s JobSet/Kubeflow on the roadmap.
As training scales, “rare per-GPU faults” become daily cluster events. The post pins the intuition with arithmetic: if each GPU survives a day with probability 99.9%, a 10,000-GPU job finishes that day uninterrupted with probability ≈0.999^10000 ≈ 0.005%. An 11-month Meta study of 24,000 A100s is cited: hardware failures interrupted <1% of jobs but those jobs accounted for 19% of GPU runtime—the largest, longest jobs are most exposed.
NVIDIA Recovery places the answer at a workload-level control loop: not only remediating nodes, and not only asking every user to wire NVRx, but detecting interruptions, attributing, isolating, and restarting from checkpoints across jobs around the clock. Falsifiable claim: cluster goodput is increasingly bottlenecked by recovery coverage and latency, not by another manual-rerun runbook.
[1]What shipped
Recovery is positioned as the dedicated workload-recovery layer in DSX OS, alongside NVSentinel/health validation, in-job NVRx, and Slurm/K8s managers, without hard dependencies. The control plane speaks HTTP/gRPC to a cluster-side Advisor Controller; recommendations follow a common API translated into scheduler actions—so application code and scheduler internals stay untouched.
New installs default to monitor mode: publish intended actions into an audit trail without touching the scheduler; enable action per cluster after comparing to human decisions. The trail records detection pattern, action (kill/requeue/release/node exclusion), timestamp, workload id, and Attribution verdict when present. A watchdog keeps normal scheduling moving if recovery decisions stall.
[1]How hard is the evidence?
Mechanism is fully specified: Detect covers PyTorch/NCCL/CUDA/interconnect patterns, hangs, and throughput stragglers vs a recent baseline; Attribute can use scheduler/logs and optional Attribution; Isolate tracks implicated nodes across attempts; Restart/Stop uses existing checkpoint logic and can halt retries that fail to write new checkpoints.
Quantitative evidence is from one training cluster over three months: ~200 jobs/day, ~8,550 anomaly detections, mean detection/action 69/94 seconds—action latency ends at the automated action; scheduling and checkpoint restore are separate. These are vendor ops numbers, not a multi-site controlled trial. External paths name IBM Research (monitor then autonomy) and Verda (VictoriaLogs connector), still mostly narrative.
[1]Steelman and gaps
Steelman: 3 a.m. log reading does not scale; cordoning broken nodes alone can still requeue onto bad capacity; in-job libraries only help teams that integrate them correctly. Monitor-first plus an audit trail is a responsible product posture.
Gaps: latency/detection counts are not broken down by failure class or success rate; “recovery action” vs “productive training restored” is distinguished but the latter distribution is not published; Slurm is primary today, with JobSet/Kubeflow and job arrays on the roadmap; tight narrative coupling to Attribution may understate capability without it.
[1]Who pays / what to watch
Idle GPU-hours and time-to-convergence pay. Across many smaller jobs, interruptions accumulate as ops burden; in large jobs each interruption multiplies by GPU count. Automated recovery addresses both bills.
Over six months, watch whether native K8s recovery lands on schedule; whether external failure patterns enter the same review stream; and whether more sites publish monitor→action false-positive/negative curves.
[1]Close
Node remediation and in-job libraries remain necessary, but they are not a complete answer for cluster goodput. NVIDIA Recovery frames the missing loop: automate detection and isolation advice at the workload boundary first, then decide whether to trust it to act—otherwise rare hardware faults keep taxing wall-clock time as a daily tax.
[1]