
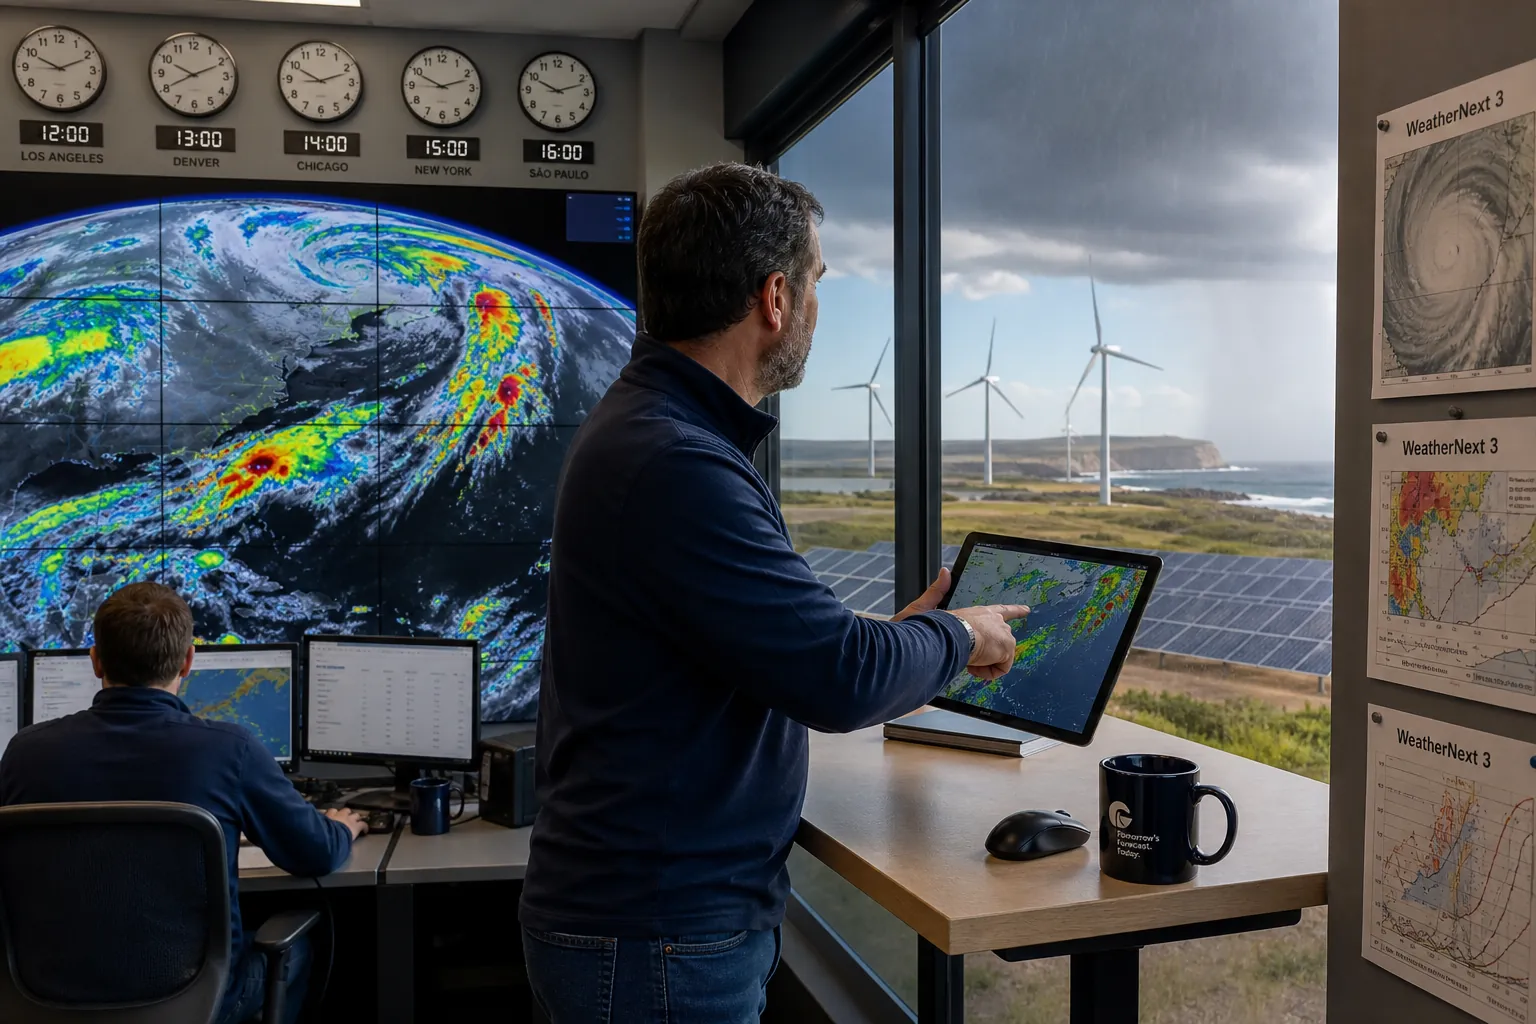
Most AI-weather stories stop at a leaderboard. WeatherNext 3’s sharper edge is dirtier: it attacks data lag.
On September 3, Google DeepMind and Google Research launched WeatherNext 3. The official brief is loud—top global model on Brightband’s live evals; surface fields down to about 5 km, other surface near 10 km, atmospheric variables near 25 km; roughly five times sharper than WeatherNext 2’s 25 km / 6-hour grid. The operational change is the input path: live hourly geostationary satellite mosaics plus traditional analysis, fed through a Functional Generative Network mesh transformer that emits dense grids, cyclone tracks, and station coordinates in one pass.
Legacy pain is the roughly six-hour NWP analysis lag. TechTimes cites DeepMind’s cut from about seven hours of typical lag to three or four. For storms, fronts, and convective rain that rewrite the sky in tens of minutes, hourly refresh is not polish—it is whether you move half a beat earlier. Precipitation remains the soft spot for global models; Google reports medium-range CRPS gains up to about 60% versus IMERG, 30% versus MRMS, and 10% versus gauges at early leads. On Search / Gemini / Maps, the company claims up to ~50% better precipitation skill a day or more ahead, with the biggest lifts where forecasts have historically been weakest.
The other product line is for the grid. The model forecasts ~100-meter winds (near hub height), high-resolution cloud cover, and surface radiation—fields wind and solar desks actually ingest. Clean-energy variables are not brochure garnish: operators bet all day on what the sky will do next hour. An AI still chewing stale analysis is yesterday’s satellite glued onto today’s generation curve.
Distribution is pure Google: queryable in BigQuery and Earth Engine, bulk download from Cloud Storage, and live in Search, Gemini, Maps, the Maps Platform Weather API, and Earth Engine from day one. Weather Lab visualizes the stream. Docs matter more than slogans here: 64 ensemble members, 15-day horizon on the main 6-hourly inits, shorter 48-hour horizons on interim hourly runs.
Take: this is less a “beat ECMWF” cage match than an engineering bet to shove real-time observations into consumer and cloud pipes. Regions across Latin America, Africa, and Asia-Pacific that cannot buy traditional high-res regional models stand to gain more from a true 5 km global field than from another paper trophy. Caveat stands: Google’s own disclaimer sends severe weather back to national services; denser AI maps do not replace the warning chain. Watch whether Brightband’s live board holds, and whether renewable dispatch error shrinks in real control-room ledgers—that number is more honest than launch-day resolution claims.
[1][2]